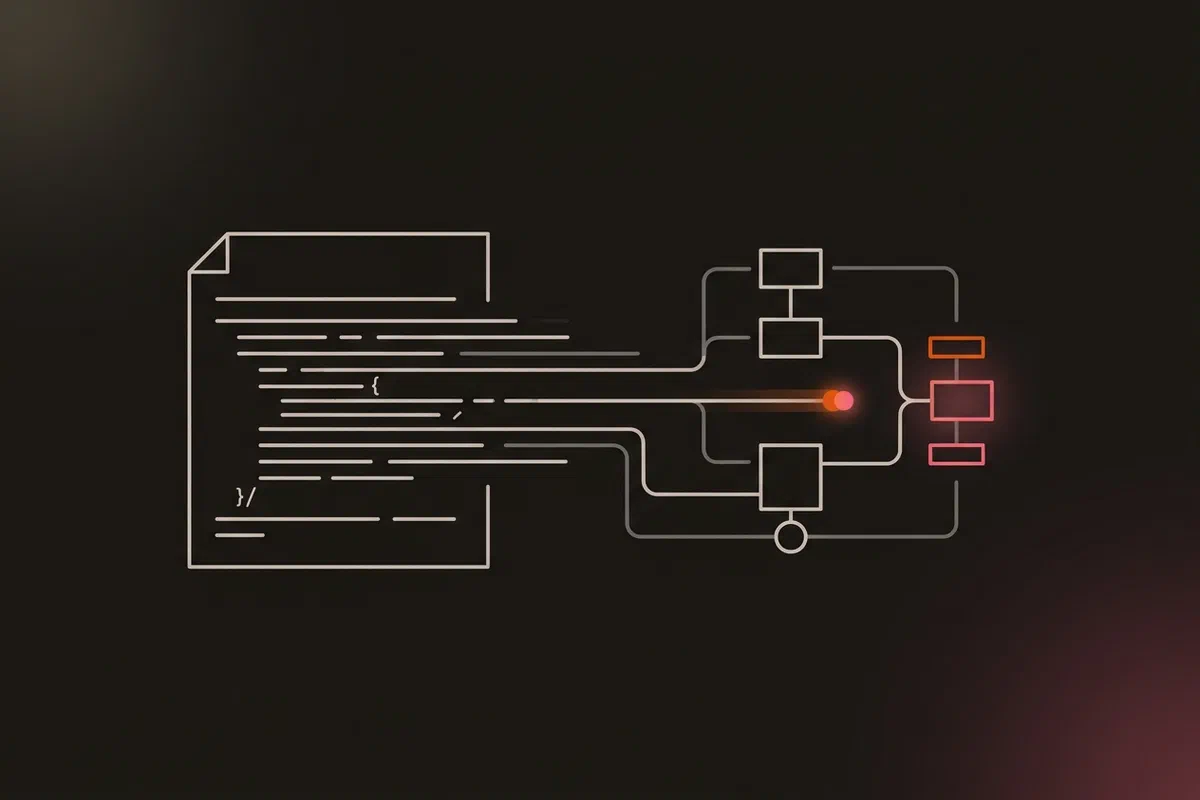


Most of the diagrams in this series came out of a Python script. So did the ones on the status page and in the project’s README. None of them were drawn in a drawing tool.
That started with a stale chart. The README had a Mermaid chart that had fallen out of date, and nothing ever compared it with the project it described. I replaced it on 16 November with an SVG generated by a script, then moved the drawing code into a shared module and wrote one small builder per flow. By 19 November there were nine builders and one command to rebuild them all.
This post covers how that’s put together, the animation that shows one flow at a time, and the rules that make the diagrams safe to publish from a public repo.
One style module, one builder per flow #
Every builder starts the same way:
from aether_style import *
import aether_style

aether_style.DATE_STAMP = "as of 19 Nov 2026"   # sync waves added (5.17)
The style module holds the palette, the font, and a small set of drawing primitives: zones for each site, nodes, chips, routes with arrowheads, a legend and a title row. A builder is mostly coordinates and labels. Its docstring lists the sources it was drawn from (ADRs, workflows, incident reviews), so a reviewer can check the picture against the documents.
One command rebuilds everything:
for b in BUILDERS:
    subprocess.run([sys.executable, str(HERE / b)], check=True)
for src, dst in STATUS_PAGE.items():
    shutil.copyfile(HERE / src, ASSETS / dst)
The second loop matters. The status page serves its own copies of the diagrams, and two copies of a file drift apart unless something keeps them identical. task diagrams writes both in the same run.
The first refactor had a strict test: when the drawing code moved from the architecture builder into the shared module, the architecture SVG had to come out byte-identical. A diff of the output proved the move changed nothing.
One story at a time #
A diagram of a whole system shows everything at once, and the reader has to trace each flow by eye. These animate instead: a dot hops along each route of one flow, each node lights up as the dot reaches it, and the lit path stays on until that flow ends. Then the next flow starts. The backups diagram from part 18 plays four stories in turn: the etcd snapshot, the app data, the cloud host, and the heartbeats.
a = Anim()
a.story(ETCD, e1, [(d_e12, e2), (d_e23, e3), (d_e34, e4)], leg[0])
a.story(APPS, a1, [(d_a12, a2), (d_a23, a3), (d_a34, a4)], leg[1])
a.story(CLOUD, c1, [(d_c12, c2), (d_c24, c4)], leg[2])
A few choices that came from watching them, not from planning:
- Half a second per hop. Faster than that read as noise.
- SMIL, not JavaScript. The animation is
<animate>and<animateMotion>elements inside the SVG. The file works as a plain<img>, needs no script, and passes the status page’s strict CSP from part 21. - The still frame is complete. The animation is an extra layer over a drawing that already reads on its own, so a README preview, a PNG export, or a reader who doesn’t wait still gets the whole picture.
- Reduced motion is respected. One line of CSS in the SVG hides the animation layer when the reader’s system asks for less motion:
style = "@media (prefers-reduced-motion: reduce){.anim{display:none}}"Each finished file is 23 to 38 KB.
Safe to publish from a public repo #
The repo is public, and so is the status page. Every builder carries the same rule in its docstring: role-level only, no IP addresses, hostnames or port numbers. A node is “worker 1” or “the edge VM”, never its name on the mesh. It’s the same rule the incident reviews follow.
That rule is a convention, not a check. Nothing scans the SVGs the way the blog’s leak check scans these posts, which is a gap I should close. What it has going for it is that the labels are short strings in a Python file, reviewed in the same diff as everything else, and the generated SVG is plain text a search can read.
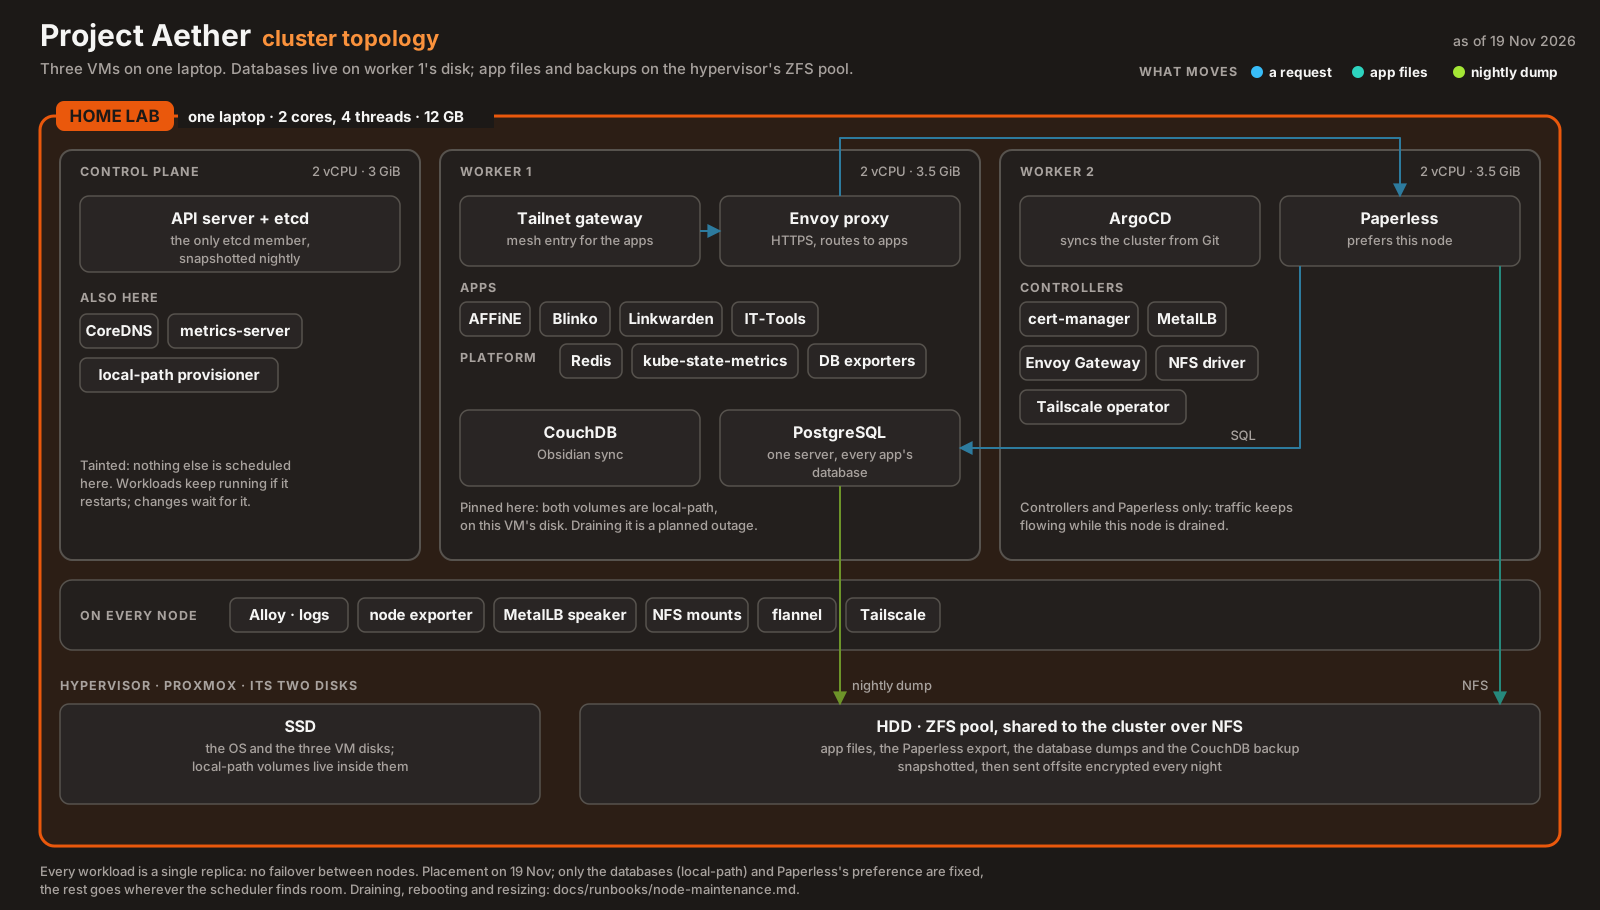
Every diagram is dated. The date sits in the top-right corner, and a builder sets its own when it’s redrawn. The topology diagram says 19 November because that’s the placement it shows. When something moves, the diagram is redrawn and the date changes. A diagram without a date claims to be current forever.
Where the time actually went #
Most of the work was layout, not drawing code:
- Chips that overlap, and routes that cross labels. There’s no layout engine. Every coordinate is chosen by hand, and every diagram needed a review pass to move labels clear of borders and arrows.
- A zone with no subtitle still drew its background strip. The fix is the first line of the subtitle code:
    if not sub:
        return
sw = round(len(sub) * 7.6 + 20) # a strip of background so the border doesn't run through the text- Text width is a guess. SVG can’t measure text before it’s rendered, so chip and strip widths come from a per-character estimate tuned for the one font the diagrams use.
- Light theme. When the status page got a light theme, the diagrams stayed dark, shown as plates on the light page, so one file serves both themes.
Some diagrams for these posts live in the blog’s repo instead, built with the same style module (the pod-security diagram in part 23 is one). The project’s build script copies them to the status page when they’re present and leaves the committed copy alone when they aren’t.
What I learned #
- A diagram nobody regenerates goes stale silently. Generating it from code, in the same repo, puts it in the same review as the change it describes. (
defac61) - Animate one flow at a time. A whole system shown at once is a map. One flow at a time is an explanation. (
aa6d3b1) - Make the still frame complete, and treat motion as an extra layer that can be turned off.
- Date every diagram. It tells the reader how much to trust it.
- A publishing rule without a check is only as good as the reviewer. The role-level rule holds today because the labels are reviewed. A scan would make it hold by default.
Architecture takeaways #
A diagram is a cache of the system’s state #
Kubernetes controllers never trust a stored picture of the cluster. They re-read the API server and compare it with what they want, every loop, because the cluster changes underneath any picture of it. A diagram is that kind of picture: a cache of state at one moment. A dated, generated one at least admits it’s a cache and makes refreshing it cheap. The source of truth is still kubectl get, the Terraform state and the running config.
Keep the derived output next to its source #
The diagram builders live beside the docs they illustrate, run from one task, and write every copy that gets published. That’s the same reason Helm charts render manifests from values in the same repo rather than shipping hand-edited YAML: when the output is derived, the only thing to keep correct is the input.
Previous: Pod Security, Honestly · All posts in the series