

In part 6 I told the story of a worker whose tailnet path fell back to a relay. One of the two NATs between my home and the internet held a mapping that let packets out but never let replies in. Moving the worker’s Tailscale daemon to a different UDP port gave both NATs a fresh mapping, and the path went direct. The incident review ended with a follow-up: an alert for any peer that stays relayed for more than 30 minutes.
Eleven days later, on the night of 19 November, the same worker fell back to the relay again. The alert would have caught it. It had never been built.
This is a short one, from INC-2026-017. It’s less about the fault than about the follow-up.
Four things down at once #
At 23:46 UTC, KubeStateMetricsDown fired, and HomelabNodeDown followed under a minute later. Both resolved on their own two minutes after that. For four minutes, Prometheus on the app host couldn’t scrape the worker’s node exporter, kube-state-metrics, or the PostgreSQL and Redis exporters.
That looked like four failures. It was one. All four are scraped through that worker’s tailnet name, so one bad path took out all four at once. No app went down: app traffic reaches the cluster through its own tailnet gateway, which wasn’t affected.
Diagnosis in a few minutes, because it had happened before #
The first review had named the symptom, so the check was quick:
tailscale pingfrom the worker: “via DERP, direct connection not established”, to every peer, including the other worker on the same LAN.- The other two nodes, behind the same router and the same carrier-grade NAT, were direct.
- The logs showed the ISP had changed the home network’s public IPv4 address at 11:42 that day. Every node lost its direct paths for about a minute, and all of them found new ones. The app host last confirmed a direct path to the worker at 15:29. At 23:24 it started using a relay, and at 23:45 the relay connection stalled.
Moving the worker to another UDP port brought the direct path back on the first ping, at 23:59. Same fix, same result.
Why the fixed port was the weak spot #
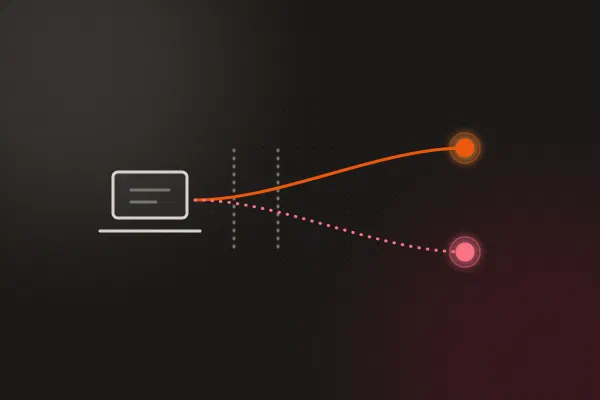
The home network is behind two NATs, the router and the ISP’s carrier-grade NAT. When the ISP changed the public address, every node got new external mappings. The other two nodes go out through ports the NAT chooses, so they simply got fresh ones. The worker’s port was fixed, and its new mapping ended up in the same one-way state as the first time.
So the first fix didn’t remove the problem. It moved the worker off one bad mapping and pinned it to whatever came next. I still don’t know which NAT holds the bad entry, since only the home router is mine to inspect, and changing the port is still the cure. What’s different this time is that the next occurrence will page as itself.
Reference: Networking services in my knowledge base covers how NAT maps ports at the transport layer, and carrier-grade NAT.
The alert, built this time #
A timer on the app host runs every minute. It reads tailscale status --json and writes one metric per peer Prometheus scrapes, through node exporter’s textfile collector: 1 if the path is direct, 0 if it’s relayed. Then two rules:
- alert: TailnetPeerRelayed
  expr: aether_tailscale_peer_direct == 0
  for: 30m
  labels:
    severity: warning
    tier: homelab
  annotations:
    summary: "The monitoring host reaches {{ $labels.peer }} only through a Tailscale relay"
    description: "No direct path for 30 minutes, so scrapes of {{ $labels.peer }} will time out whenever the relay stalls. Check `tailscale ping` from the peer; if it stays on DERP, give that node a new tailscale_port in the inventory (INC-2026-011)."

- alert: TailnetPathCheckStale
  expr: (time() - aether_tailscale_paths_timestamp_seconds > 600) or absent(aether_tailscale_paths_timestamp_seconds)
  for: 10m
The second rule is there because the first one can’t fire if the check stops running, and a silent check looks exactly like a healthy one. Both rules have promtool unit tests. On 19 November, TailnetPeerRelayed would have fired at about 23:54, 30 minutes after the path went to the relay, with the fix in its description. The first stall came earlier, at 23:45. But in the first incident the stalls repeated every 20 to 60 minutes, so the alert would have named the cause before the next round of scrape failures, instead of leaving them to look like noise.
Two details from building it:
Relayin the status JSON doesn’t mean relayed. It names the peer’s home DERP region whether the path is direct or not. OnlyCurAddr, which is set while a direct path exists, tells you. The script’s comment says so, because it’s the obvious field to reach for.- One peer is left out on purpose. The DMZ observer from part 16 has only a public IPv6 address, and nothing else here has IPv6, so every path to it is relayed by design. An alert on it would never stop firing. Deciding what not to alert on is part of the design.
What I learned #
- A follow-up that isn’t in the backlog doesn’t exist. The first review promised this alert. It lived only in the review, and the same failure came back before anyone built it. (INC-2026-017)
- Pinning something to escape a bad state pins you to the next one. When the public address changes, check the pinned node first. (INC-2026-011)
- When several targets fail together, look for the shared path before treating them as separate faults.
- Alert on the condition, not only on its symptom. Scrape failures only showed up when the relay stalled. Being relayed at all is the condition, and it’s visible from the moment the path changes.
Architecture takeaways #
Measure the path separately from the target #
A central Prometheus scraping over one network path measures that path as much as the target. Kubernetes avoids this for node health: the kubelet renews its own Lease, and the node controller waits out a grace period before calling a node NotReady, so one bad link isn’t read as a dead node. I can’t change how Prometheus reaches the homelab, so the path gets its own metric and its own alert, and a scrape failure can be read in that light.
Shared fate hides behind a shared name #
Four exporters sat behind one tailnet name, so they shared one path and failed together. Kubernetes Services exist partly so that a client’s view of a backend doesn’t depend on one address. On the mesh, the lesson is cheaper: know which targets share a path, and expect them to fail as a group.
Previous: The Rebuild I’d Never Run · All posts in the series