

In early November I ran an audit of Project Aether’s backups. I expected to tick boxes. Every job exited 0, every log ended in some version of “complete”, and the 3-2-1 diagram in my decision records looked tidy.
Instead, the audit found five separate ways the backups were failing while reporting success. A heartbeat that had never once arrived. A “second disk” that was a folder on the first disk. Timers on two clocks. Two schedulers running the same job. A monitor window with no slack at all. None of these lost data, and that’s the uncomfortable part: I only know because I went looking.
This post walks through all five, with the incident reviews behind them (INC-2026-001, INC-2026-007 and INC-2026-008), plus a bonus from logging that follows the same pattern. Each one ends with the change that makes the failure loud.
The setup #
There are two backup chains, and both matter here.
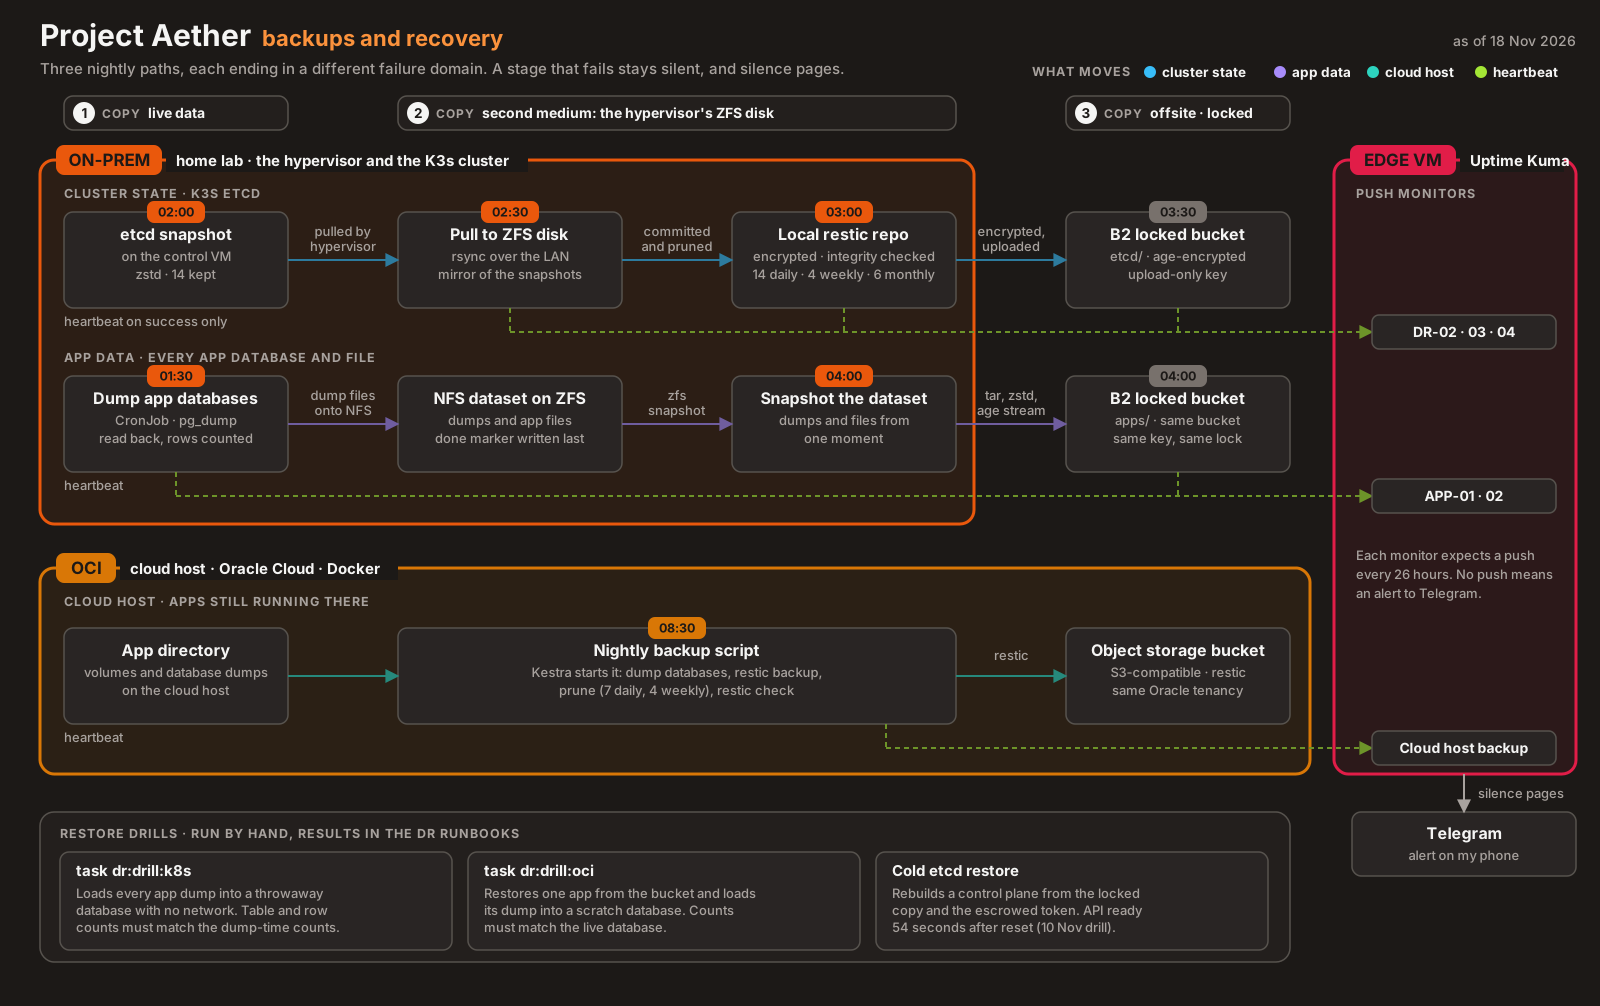
- The app host (an Oracle Cloud VM running my Docker Compose services) dumps its databases every night and backs everything up with restic to S3-compatible storage. When it finishes, it pushes a heartbeat to Uptime Kuma on the DMZ observer, a Google Cloud VM that watches everything from outside. No heartbeat in a day means an alert.
- The K3s control plane takes an etcd snapshot every night. Three stages on the hypervisor then carry it outward: pull the snapshots to a local mirror, back the mirror up to an encrypted restic repository on the HDD, and copy that repository to Backblaze B2.
On paper, that’s three copies on two media with one offsite. Here is what was actually true.
Lie 1: The heartbeat that never beat #
The app host’s heartbeat monitor on the DMZ observer was red. It had been red since the day I created it, which is exactly why nobody looked at it. A monitor that’s always red reads as “known issue”, not as “alert”.
The cause was one line in an env file that Ansible rendered without quotes:
export UPTIME_KUMA_PUSH_URL=https://<observer>/api/push/<token>?status=up&msg=OK&ping=The backup script ran source restic.env. To bash, each & in that line means “run the previous command in the background”. So the export got only the text up to the first &, inside a background subshell, and the variable in the script stayed empty. A URL query string is shell syntax once you source it.
That alone would have been a visible failure. The script made sure it wasn’t:
#!/bin/bash
source /opt/backup/restic.env

docker exec blinko-postgres pg_dump -U postgres postgres > {{ app_base_dir }}/blinko/db.sql || true
# ... three more dumps, each ending in || true
restic init || true
restic backup {{ app_base_dir }} --exclude=...
restic forget --keep-daily 7 --keep-weekly 4 --prune

curl -s -m 10 --retry 3 "$UPTIME_KUMA_PUSH_URL" > /dev/null || true
echo "==> Backup Complete!"
No set -e, so a failed restic backup carried on to the next line. || true on every dump, so a failed pg_dump left yesterday’s SQL file in place and restic happily backed it up again. || true on the heartbeat, so an empty URL was fine too. And an unconditional “Backup Complete!” at the end. The script couldn’t fail if it tried.
The fix (0826dc5, ffbc283) inverts all of that. Ansible’s quote filter on every value in the env file. Fail fast. Dumps go to a temp file and replace the old one only on success. restic check runs every night. The heartbeat is the very last thing, and it only fires if everything before it passed:
set -Eeuo pipefail
source /opt/backup/restic.env
: "${UPTIME_KUMA_PUSH_URL:?UPTIME_KUMA_PUSH_URL is empty: check quoting in restic.env}"

failed=0
dump() {  # container user db outfile
  docker exec "$1" pg_dump -U "$2" "$3" > "$4.tmp" && mv "$4.tmp" "$4" \
    || { echo "ERROR: pg_dump $1/$3 failed"; rm -f "$4.tmp"; failed=1; }
}
# ... dumps, restic backup, forget, then:
restic check

if [ "$failed" -ne 0 ]; then
  echo "Backup finished WITH ERRORS: heartbeat withheld"; exit 1
fi
curl -fsS -m 10 --retry 3 "$UPTIME_KUMA_PUSH_URL" >/dev/null
Then I proved it the only way that counts: I broke a pg_dump on purpose and checked that the heartbeat was withheld and the run exited 1. It was. That test also found the next problem.
Lie 2: Two schedulers, one repository #
The negative test withheld the heartbeat as it should, but it stopped in the wrong place: on a restic repository lock, held by another backup that had started seconds earlier.
That one turned out to be me. I’d started the test command twice, 11 seconds apart. But chasing it surfaced a real one: the audit had already found two schedulers running the backup every night. A root cron job at 03:00 UTC, left over from before I moved the job into Kestra, and the Kestra flow at 03:30. Each one “succeeded”. Nothing stopped them, a manual run, or a Kestra retry from overlapping on the same repository.
The fix was one scheduler (the same Ansible task now removes the cron entry) and a run lock at the top of the script, on a path that both the host and the Kestra container mount:
exec 9>"{{ app_base_dir }}/.restic-backup.lock"
flock -n 9 || { echo "ERROR: another backup is running"; exit 1; }
restic unlock   # removes only stale locks (dead PID on this host, or older than 30 min)
With the lock held, a second run prints another backup is running and exits 1. Since then: one snapshot per night, one heartbeat per night.
Lie 3: The second disk that was a folder on the first #
The homelab’s etcd chain claimed two local media: the live snapshot on the control-plane VM’s disk (on the SSD), and a mirror plus restic repo on the hypervisor’s HDD. The jobs wrote to /mnt/aether-pool/, and they wrote successfully every night.
A re-audit ran findmnt on that path and got ext4 on the root volume. The ZFS pool on the HDD was mounted at /aether-pool, without the /mnt, and held 1.48 MiB. The DR copies had been living on the same SSD as every VM disk since the pipeline was built (INC-2026-007). One SSD failure would have taken the VMs, the live etcd, the mirror and the local repo together, leaving only B2.
How does that happen silently? mkdir -p and Ansible’s file: state=directory both create a missing path for you. When the first job ran and found no mount, it made a directory on the root filesystem, and every job after that worked perfectly. From inside the job, a directory on the SSD and a dataset on the HDD look the same.
The fix made each DR path its own ZFS dataset, mounted exactly where the jobs already wrote, with the data copied first and verified with diff -rq before the old directory was moved aside. Then a guard, in the playbooks and again in every script, because a dataset can fail to mount after a reboot:
for p in /mnt/aether-pool/k3s-etcd-snapshots /mnt/aether-pool/restic-k3s-etcd; do
  [ "$(findmnt -n -o SOURCE --target "$p" 2>/dev/null)" = "aether-pool/$(basename "$p")" ] \
    || { echo "ERROR: $p is not the aether-pool ZFS dataset (not mounted?)"; exit 1; }
done
The test: unmount the snapshot dataset, run the sync job. Exit 1, nothing written to the SSD.
One more honest correction from the same review. My design doc called this “the ZFS HDD mirror pool”. It’s a single-disk vdev. I set copies=2, which repairs bad sectors, and the doc now says plainly that it does not survive losing the disk.
Lie 4: A timer that starts its own job, on the wrong clock #
The three etcd stages each have a systemd timer, and each timer unit had a line like this (INC-2026-008):
[Unit]
Requires=k3s-etcd-restic.service

[Timer]
OnCalendar=*-*-* 03:00:00 UTC
I read Requires= as “this timer needs that service to exist”. It isn’t. In a .timer it’s an ordinary unit dependency, so starting the timer also starts the service: on systemctl start, on a restart, on boot. A timer already triggers its same-named service on schedule, so the line added nothing except that side effect.
It showed up as a red unit next to a green one. On 2 Nov and again on 5 Nov, a playbook started a timer and then ran the stage once by hand. Two runs of the same stage went in at once, the timer-started one failed on the restic lock (exit 11), and the manual one succeeded. A failure beside a success looks like a one-off, so the first time I let it go. After any reboot, all three stages would have started at once, with the restic and B2 copies racing the pull they depend on.
The same review found the clock problem. K3s takes its snapshot at 02:00 in the node’s time zone, which is IST. The hypervisor’s timers were written in UTC, so the “02:30” pull actually ran six hours after the snapshot. The offsite copy could be up to about 31 hours old instead of 25.5. And the restic stage treated an empty snapshot folder as a warning and exited 0.
The fix (778c9d0):
[Unit]
# No Requires=: in a .timer it starts the service whenever the timer starts.

[Timer]
# One clock (IST) for the whole pipeline: K3s snapshot 02:00 -> sync 02:30 -> restic 03:00 -> B2 03:30.
OnCalendar=*-*-* 03:00:00 Asia/Kolkata
Persistent=true
Every way of running a stage, timer or playbook, goes through one shared lock, so stages queue instead of colliding:
ExecStart=/usr/bin/flock -w 3600 /run/lock/k3s-etcd-dr.lock /usr/local/bin/backup-etcd-restic.shAn empty snapshot folder now exits 1. A later addition (after a night when the pull failed for an unrelated reason and the next two stages “succeeded” on yesterday’s mirror) also fails the run if the newest snapshot is more than 26 hours old. Each stage pushes its own heartbeat only on success. I checked the fix with a deliberate collision: with the lock held, a queued restic run waited, then succeeded. Two clean unattended nights followed before I closed the incident.
Lie 5: A monitor window with zero slack #
The last one is small, and it’s the one I’d have missed without staring at timestamps.
After the heartbeat fix, the push monitor’s interval was 86,400 seconds: exactly the 24-hour schedule. On 5 Nov the push arrived six seconds later than on 4 Nov. Kuma marked the monitor PENDING (“No heartbeat in the time window”) for five seconds. One retry kept it from paging. A slightly slower night would have paged for a backup that was fine.
A monitor window equal to the job period means normal jitter is an alert. The fix was a 25-hour window (90,000 s) and zero retries: an hour of slack for a slow run, and a page by about 04:00 UTC on a morning the backup is missed or fails.
Bonus: logs that were “verified” on the one node that worked #
Same week, different pipeline (INC-2026-006). Promtail ships logs from all three K3s nodes to Loki on the app host. The phase exit gate asked “do all three nodes appear in Loki?” Only one did. One worker had never shipped a line, and the control plane had stopped around 30 Oct.
The two failing nodes listed public resolvers first, and public DNS gave them an address for Loki’s private name that didn’t serve Loki. The dnsPolicy: ClusterFirstWithHostNet I’d set to prevent exactly that wasn’t a value the chart supports, and Helm dropped it without a word. Log shipping had been verified once, at deploy time, on the one node that worked. The fix points Promtail at Loki’s fixed private overlay address and takes DNS out of the path. A per-node “shipping stalled” alert is still a follow-up.
What I learned #
|| truein a backup script turns every failure into a success. Fail fast, then decide what success means in one place, at the end. (INC-2026-001)- A monitor that has never been green isn’t monitoring. Treat “always red” as an incident, not as background.
- Check where a backup landed, not just that it landed. A path is not a disk. (INC-2026-007)
- “Nothing to do” is a failure for a backup job. Exit non-zero and let alerting decide. (INC-2026-008)
- Every negative test found the next problem. The broken
pg_dumpfound the lock collision. The unmounted dataset proved the guard. Run them, and keep them in the runbook.
Architecture takeaways #
Success is decided outside the job #
Every one of these jobs reported on itself, and every one was wrong. The heartbeat fix works because the signal comes from somewhere else: a machine outside the failure domain that pages when it doesn’t hear from the job. The job’s only power is to stay quiet. Don’t build systems where the thing being measured also writes the verdict.
Verify the property, not the proxy #
“Files arrived in /mnt/aether-pool” was a proxy for “the copy is on a separate disk”. “The service is running” was a proxy for “logs reach Loki from every node”. The guards that fixed things check the property itself: the mount source of the path, the per-node presence in Loki, restic check on the repository. Proxies are fine until they drift away from what they stand for, and they drift silently.
One clock, one scheduler, one lock #
Three of the five lies were coordination failures: two schedulers, two time zones, two runs of one stage. A pipeline that crosses machines needs one written-down clock next to its first stage, one owner for “when does this run”, and one lock that every entry point takes. Then a collision becomes a queue, not a race.
Make the alarm sensitive to failure and deaf to jitter #
The zero-slack window is the other side of the always-red monitor. One pages so often it’s ignored, the other never pages at all. A good threshold sits between normal variation and real failure: here, one hour of slack on a 24-hour job, no retries, so a missed night pages within the hour.
Previously in the series: the tag that meant two things, where a quick fix to my monitoring opened my admin tools to the DMZ. Every part is listed on the series page.