

Maintaining uptime and monitoring system health is crucial for any organization. Real-time monitoring ensures that issues are identified and resolved quickly, minimizing downtime and maintaining service reliability. In this blog, we’ll walk through a comprehensive DevOps monitoring project that leverages Prometheus, Node Exporter, Blackbox Exporter, and Alertmanager to provide real-time alerts and monitoring.
Project Overview #
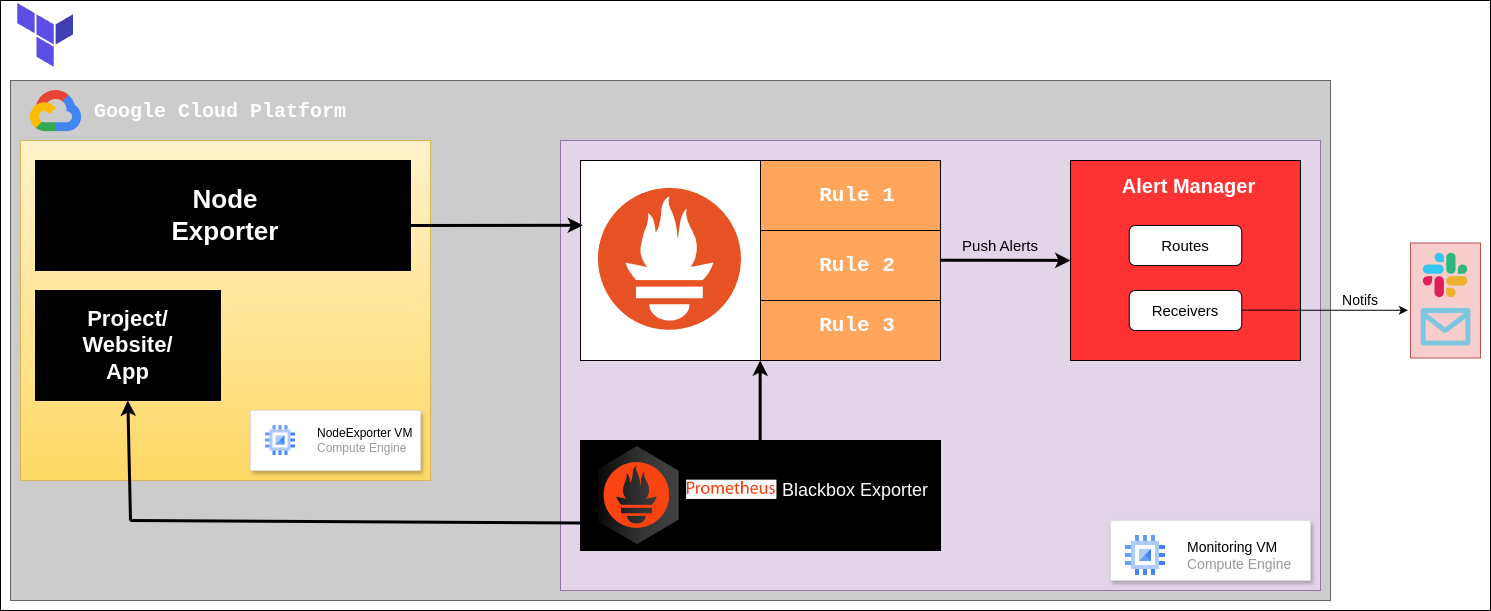
The project aims to set up a real-time monitoring system that:
-
Monitors websites, deployed app and virtual machines (VMs).
-
Sends email notifications for specific conditions such as website downtime, VM unavailability, service crashes, and resource exhaustion.
Components and Tools #
The key components used in this project are:
-
Prometheus: A powerful monitoring and alerting toolkit designed for reliability and scalability.
-
Node Exporter: Used to monitor hardware and OS metrics exposed by *nix kernels.
-
Blackbox Exporter: Allows probing of endpoints over HTTP, HTTPS, DNS, TCP, ICMP, and gRPC.
-
Alertmanager: Handles alerts sent by client applications such as Prometheus and manages silencing, inhibition, aggregation, and sending notifications via methods such as email.
Use Cases #
The scenarios covered in this project include:
-
Website Downtime: Alerts if the website is inaccessible for more than 1-2 minutes.
-
VM Unavailability: Alerts if a virtual machine is down for more than 1 minute.
-
Service Crashes: Alerts if a specific service (e.g., Node Exporter) on a VM is stopped or unavailable.
-
Resource Exhaustion: Alerts if there is no storage or memory left on a VM or if the CPU usage is excessively high.
How It Works #
-
Infrastructure Setup:
-
You create a network and two virtual machines (VMs) on Google Cloud Platform (GCP) or any other cloud.
-
One VM (Monitoring VM) runs Prometheus, Blackbox Exporter, and Alertmanager.
-
Another VM (Node Exporter VM) runs Node Exporter.

-
-
Monitoring:
-
Monitoring VM:
-
Prometheus collects data from the Node Exporter and Blackbox Exporter.
-
Blackbox Exporter checks if specified websites are running.
-
Alertmanager is set up to send email notifications when certain conditions are met.
-
-
Node Exporter VM:
- Node Exporter collects and provides server metrics like CPU usage, memory usage, etc., to Prometheus.
-
-
Data Collection and Monitoring:
-
Prometheus:
-
Regularly collects metrics from Node Exporter and Blackbox Exporter.
-
Checks these metrics against predefined rules.
-
-
Blackbox Exporter:
- Probes (checks) specified websites to ensure they are running.
-
Node Exporter:
- Collects and provides server metrics to Prometheus.
-
-
Alerting:
-
If Prometheus detects an issue (e.g., a website is down, or a server is overloaded), it triggers an alert.
-
The Alertmanager receives this alert and sends an email notification to the specified addresses.
-
Setting Up the Environment #
Step 1: Create Virtual Machines and Install Tools #
-
By leveraging GCP’s metadata feature of VM creation, I used Terraform to create Infrastructure and Install the required tools during VM creation. You can replicate project directly:
git clone https://github.com/ChetanThapliyal/real-time-devops-monitoring.git
cd real-time-devops-monitoring/Infra
terraform init
#add appropriate Service Account key and tfvars
terraform apply
# Infra is ready with installed tools
Step 2: Configure Monitoring Tools #
Create Alert Rules #
-
Let’s defines a set of alerting rules for Prometheus. These rules monitor various metrics and trigger alerts based on specific conditions. Create a file
alert_rules.ymlin Prometheus folder:cd /opt/prometheus vi alert_rules.yml#alert_rules.yml groups: - name: alert_rules # Name of the alert rules group rules: - alert: InstanceDown expr: up == 0 # Expression to detect instance down for: 1m labels: severity: "critical" annotations: summary: "Endpoint {{ $labels.instance }} down" description: "{{ $labels.instance }} of job {{ $labels.job }} has been down for more than 1 minute." - alert: WebsiteDown expr: probe_success == 0 # Expression to detect website down for: 1m labels: severity: critical annotations: description: The website at {{ $labels.instance }} is down. summary: Website down - alert: HostOutOfMemory expr: node_memory_MemAvailable / node_memory_MemTotal * 100 < 25 # Expression to detect low memory for: 5m labels: severity: warning annotations: summary: "Host out of memory (instance {{ $labels.instance }})" description: "Node memory is filling up (< 25% left)\n VALUE = {{ $value }}\n LABELS: {{ $labels }}" - alert: HostOutOfDiskSpace expr: (node_filesystem_avail{mountpoint="/"} * 100) / node_filesystem_size{mountpoint="/"} < 50 # Expression to detect low disk space for: 1s labels: severity: warning annotations: summary: "Host out of disk space (instance {{ $labels.instance }})" description: "Disk is almost full (< 50% left)\n VALUE = {{ $value }}\n LABELS: {{ $labels }}" - alert: HostHighCpuLoad expr: (sum by (instance) (irate(node_cpu{job="node_exporter_metrics",mode="idle"}[5m]))) > 80 # Expression to detect high CPU load for: 5m labels: severity: warning annotations: summary: "Host high CPU load (instance {{ $labels.instance }})" description: "CPU load is > 80%\n VALUE = {{ $value }}\n LABELS: {{ $labels }}" - alert: ServiceUnavailable expr: up{job="node_exporter"} == 0 # Expression to detect service unavailability for: 2m labels: severity: critical annotations: summary: "Service Unavailable (instance {{ $labels.instance }})" description: "The service {{ $labels.job }} is not available\n VALUE = {{ $value }}\n LABELS: {{ $labels }}" - alert: HighMemoryUsage expr: (node_memory_Active / node_memory_MemTotal) * 100 > 90 # Expression to detect high memory usage for: 10m labels: severity: critical annotations: summary: "High Memory Usage (instance {{ $labels.instance }})" description: "Memory usage is > 90%\n VALUE = {{ $value }}\n LABELS: {{ $labels }}" - alert: FileSystemFull expr: (node_filesystem_avail / node_filesystem_size) * 100 < 10 # Expression to detect file system almost full for: 5m labels: severity: critical annotations: summary: "File System Almost Full (instance {{ $labels.instance }})" description: "File system has < 10% free space\n VALUE = {{ $value }}\n LABELS: {{ $labels }}" -
Let’s understand what we are doing in
alert_rules.yml -
Alert Rules Structure #
-
groups: Contains a list of alert groups. Each group can have multiple rules.
-
name: The name of the alert group.
-
rules: A list of alert rules within the group.
Individual Alert Rules #
Each alert rule has the following components:
-
alert: The name of the alert.
-
expr: The PromQL expression used to evaluate the alert condition.
-
for: The duration for which the condition must be true before triggering an alert.
-
labels: Additional labels to attach to the alert.
-
annotations: Additional information about the alert, such as a summary and description.
Explanation of Each Alert #
-
InstanceDown
-
alert:
InstanceDown -
expr:
up == 0- Checks if any instance is down (
upmetric is 0).
- Checks if any instance is down (
-
for:
1m- The condition must be true for 1 minute.
-
labels:
severity: "critical" -
annotations:
-
summary: “Endpoint {{ $labels.instance }} down”
-
description: “{{ $labels.instance }} of job {{ $labels.job }} has been down for more than 1 minute.”
-
-
-
WebsiteDown
-
alert:
WebsiteDown -
expr:
probe_success == 0- Checks if the website is down (
probe_successmetric is 0).
- Checks if the website is down (
-
for:
1m -
labels:
severity: "critical" -
annotations:
-
description: “The website at {{ $labels.instance }} is down.”
-
summary: “Website down”
-
-
-
HostOutOfMemory
-
alert:
HostOutOfMemory -
expr:
node_memory_MemAvailable / node_memory_MemTotal * 100 < 25- Checks if available memory is less than 25%.
-
for:
5m -
labels:
severity: "warning" -
annotations:
-
summary: “Host out of memory (instance {{ $labels.instance }})”
-
description: “Node memory is filling up (< 25% left)\n VALUE = {{ $value }}\n LABELS: {{ $labels }}”
-
-
-
HostOutOfDiskSpace
-
alert:
HostOutOfDiskSpace -
expr:
(node_filesystem_avail{mountpoint="/"} * 100) / node_filesystem_size{mountpoint="/"} < 50- Checks if available disk space on the root filesystem is less than 50%.
-
for:
1s -
labels:
severity: "warning" -
annotations:
-
summary: “Host out of disk space (instance {{ $labels.instance }})”
-
description: “Disk is almost full (< 50% left)\n VALUE = {{ $value }}\n LABELS: {{ $labels }}”
-
-
-
HostHighCpuLoad
-
alert:
HostHighCpuLoad -
expr:
sum by (instance) (irate(node_cpu{job="node_exporter_metrics",mode="idle"}[5m])) > 80- Checks if the CPU load is greater than 80%.
-
for:
5m -
labels:
severity: "warning" -
annotations:
-
summary: “Host high CPU load (instance {{ $labels.instance }})”
-
description: “CPU load is > 80%\n VALUE = {{ $value }}\n LABELS: {{ $labels }}”
-
-
-
ServiceUnavailable
-
alert:
ServiceUnavailable -
expr:
up{job="node_exporter"} == 0- Checks if the service (
node_exporterjob) is unavailable (upmetric is 0).
- Checks if the service (
-
for:
2m -
labels:
severity: "critical" -
annotations:
-
summary: “Service Unavailable (instance {{ $labels.instance }})”
-
description: “The service {{ $labels.job }} is not available\n VALUE = {{ $value }}\n LABELS: {{ $labels }}”
-
-
-
HighMemoryUsage
-
alert:
HighMemoryUsage -
expr:
(node_memory_Active / node_memory_MemTotal) * 100 > 90- Checks if active memory usage is greater than 90%.
-
for:
10m -
labels:
severity: "critical" -
annotations:
-
summary: “High Memory Usage (instance {{ $labels.instance }})”
-
description: “Memory usage is > 90%\n VALUE = {{ $value }}\n LABELS: {{ $labels }}”
-
-
-
FileSystemFull
-
alert:
FileSystemFull -
expr:
(node_filesystem_avail / node_filesystem_size) * 100 < 10- Checks if available file system space is less than 10%.
-
for:
5m -
labels:
severity: "critical" -
annotations:
-
summary: “File System Almost Full (instance {{ $labels.instance }})”
-
description: “File system has < 10% free space\n VALUE = {{ $value }}\n LABELS: {{ $labels }}”
-
-
These alert rules help ensure the health and availability of services by monitoring key metrics and notifying when certain thresholds are crossed.
-
Main configuration for Prometheus #
-
Now let’s edit the
prometheus.ymlfile which is the main configuration file for Prometheus and also understand the default global configuration while configuring it:cd /opt/prometheus vi prometheus.yml #uncomment line 16 and add alert_rules.yml #shown in below screenshot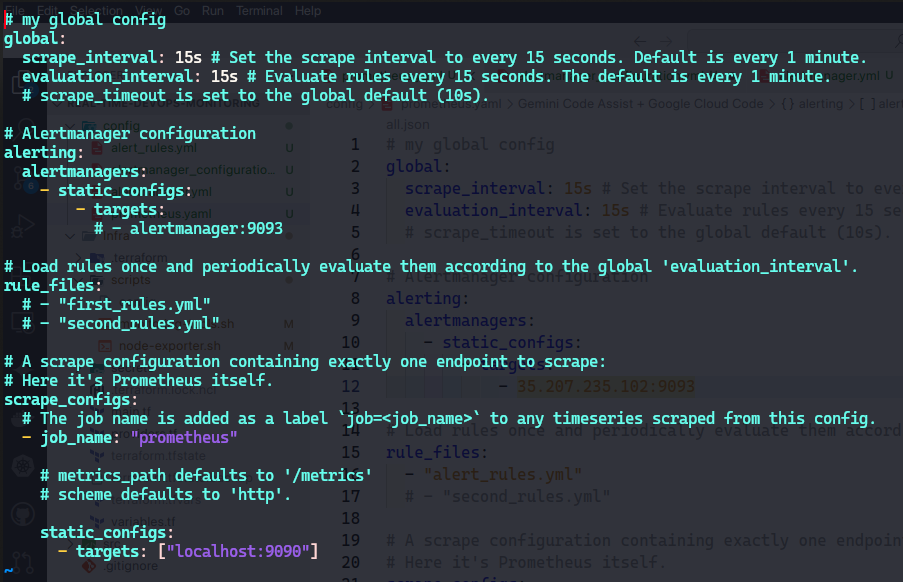
Global Configuration #
The global configuration settings apply to all scrape jobs and rule evaluations unless explicitly overridden.
global: scrape_interval: 15s # Set the scrape interval to every 15 seconds. Default is every 1 minute. evaluation_interval: 15s # Evaluate rules every 15 seconds. The default is every 1 minute. # scrape_timeout is set to the global default (10s).-
scrape_interval: 15s: This setting specifies that Prometheus will scrape metrics from all targets every 15 seconds. The default value, if not specified, is 1 minute.
-
evaluation_interval: 15s: This setting specifies that Prometheus will evaluate alerting and recording rules every 15 seconds. The default value, if not specified, is 1 minute.
-
scrape_timeout: This is not explicitly set here, so it defaults to 10 seconds. This is the maximum time allowed for a scrape request to complete.
Alertmanager Configuration #
This section configures Alertmanager instances where alerts will be sent.
-
-
Uncomment the
alertmanager:9093line and write your public IP address of Monitoring VM in place ofalertmanager:alerting: alertmanagers: - static_configs: - targets: # - alertmanager:9093 - PUBLIC_IP:9093 #write public IP of monitoring VM-
alerting: The root key for alerting configurations.
-
alertmanagers: A list of Alertmanager instances that Prometheus will send alerts to.
-
static_configs: Uses a static list of Alertmanager instances.
-
targets: The list of Alertmanager endpoints. The example contains a commented-out target (
alertmanager:9093). You would uncomment and adjust this line to specify your Alertmanager instances.
-
Rule Files Configuration #
This section specifies the rule files that Prometheus should load. These files contain alerting and recording rules.
-
-
Here we’ll add our
alert_rules.ymlthat we wrote in our last step:rule_files: # - "first_rules.yml" # - "second_rules.yml" - alert_rules.yml- rule_files: A list of file paths to rule files. In this example, the rule files are commented out. You would uncomment and provide paths to your actual rule files (
alert_rules.yml).
Scrape Configuration #
This section defines the scrape configuration for Prometheus itself. It specifies which targets Prometheus should scrape for metrics.
scrape_configs: # The job name is added as a label `job=<job_name>` to any timeseries scraped from this config. - job_name: "prometheus" # metrics_path defaults to '/metrics' # scheme defaults to 'http'. static_configs: - targets: ["localhost:9090"]-
scrape_configs: A list of scrape configurations.
-
job_name: “prometheus”: The name of the scrape job. This name is added as a label (
job=<job_name>) to any time series scraped from this job. -
metrics_path: The path to the metrics endpoint. It defaults to
/metrics, so it is not specified here. -
scheme: The protocol used to scrape metrics (HTTP or HTTPS). It defaults to
http, so it is not specified here. -
static_configs: Specifies static targets to scrape.
- targets: ["localhost:9090"]: The target endpoint for this job. In this case, it is scraping Prometheus’s own metrics endpoint running on
localhostat port9090.
- targets: ["localhost:9090"]: The target endpoint for this job. In this case, it is scraping Prometheus’s own metrics endpoint running on
-
-
We’ll add 2 jobs
Node ExporterandBlackbox exporter:static_configs: - targets: ["localhost:9090"] - job_name: "node_exporter" # Job name for node exporter static_configs: - targets: ["PUBLIC_IP_ADDRESS:9100"] # Target node exporter endpoint - job_name: 'blackbox' # Job name for blackbox exporter metrics_path: /probe # Path for blackbox probe params: module: [http_2xx] # Module to look for HTTP 200 response static_configs: - targets: - http://prometheus.io # HTTP target - https://prometheus.io # HTTPS target - http://PUBIC_IP_ADDRESS:8080/ # HTTP target with port 8080 relabel_configs: - source_labels: [__address__] target_label: __param_target - source_labels: [__param_target] target_label: instance - target_label: __address__ replacement: PUBLIC_IP_ADDRESS:9115 # Blackbox exporter address -
You can find the example configs of how to set these jobs in :
-
job_name: “node_exporter”
-
This job is named
node_exporter, and this name will be added as a label (job="node_exporter") to all time series scraped from this job. -
static_configs: Specifies static targets to scrape.
- targets: A list of targets to scrape for metrics. Here, Prometheus will scrape metrics from a Node Exporter running at
PUBLIC_IP_ADDRESS:9100. You would replacePUBLIC_IP_ADDRESSwith the actual IP address of the target node.
- targets: A list of targets to scrape for metrics. Here, Prometheus will scrape metrics from a Node Exporter running at
-
-
job_name: ‘blackbox’
-
This job is named
blackbox, indicating that it is for scraping metrics using the Blackbox Exporter. -
metrics_path:
/probe- Specifies the path for the Blackbox Exporter’s probe endpoint. The default metrics path
/metricsis overridden here.
- Specifies the path for the Blackbox Exporter’s probe endpoint. The default metrics path
-
params:
-
module: [http_2xx]
- Specifies the module for the Blackbox Exporter to use. In this case, it checks for an HTTP 200 response.
-
-
static_configs:
-
targets:
-
Lists the targets that the Blackbox Exporter will probe.
-
http://prometheus.io: An HTTP target.
-
https://prometheus.io: An HTTPS target.
-
http://PUBLIC_IP_ADDRESS:8080/: An HTTP target with port 8080. Replace
PUBLIC_IP_ADDRESSwith the actual IP address.
-
-
-
relabel_configs:
-
Defines a series of relabeling rules to manipulate target labels before scraping.
-
source_labels: [address]
-
target_label: __param_target
- Takes the value from the
__address__label and sets it as the__param_targetlabel. This configures the Blackbox Exporter to probe the original target address.
- Takes the value from the
-
-
source_labels: [__param_target]
-
target_label: instance
- Copies the value from the
__param_targetlabel to theinstancelabel, helping identify the original target in metrics.
- Copies the value from the
-
-
target_label: address
-
replacement: PUBLIC_IP_ADDRESS:9115
- Overrides the
__address__label to point to the Blackbox Exporter instance running atPUBLIC_IP_ADDRESS:9115. ReplacePUBLIC_IP_ADDRESSwith the actual IP address.
- Overrides the
-
-
-
- rule_files: A list of file paths to rule files. In this example, the rule files are commented out. You would uncomment and provide paths to your actual rule files (
-
This configuration file does the following:
-
Sets global parameters for how often Prometheus scrapes targets and evaluates rules (every 15 seconds).
-
Configures an Alertmanager instance (though commented out, you would need to provide the actual address).
-
Specifies where Prometheus should look for alerting and recording rules (currently commented out).
-
Defines a scrape configuration to scrape metrics from the Prometheus server itself.
-
-
After configuring the prometheus global configuration, restart the prometheus service:
cd /opt/prometheus
pgrep prometheus
3245  #yours will be different
kill 3245
./prometheus &
Config for receiving Mail Notification #
-
For receiving mail notifications, we’ll need to configure
alertmanager.yml: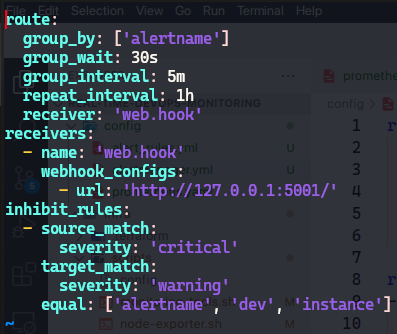
-
The
alertmanager.ymlfile is the configuration file for Prometheus Alertmanager, which handles alerts sent by Prometheus. The configuration is divided into three main sections:route,receivers, andinhibit_rules.Route #
The
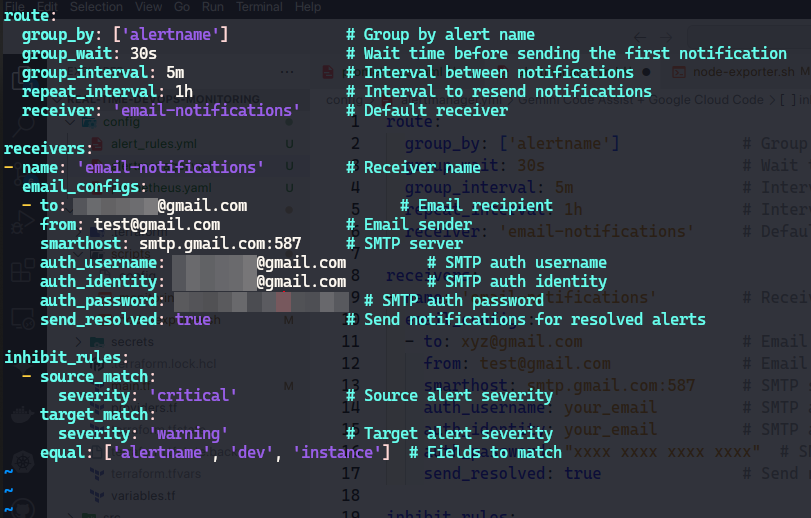
routesection defines how alerts are grouped and routed to receivers. Here’s a breakdown of the options:route: group_by: ['alertname'] # Group by alert name group_wait: 30s # Wait time before sending the first notification group_interval: 5m # Interval between notifications repeat_interval: 1h # Interval to resend notifications receiver: 'email-notifications' # Default receiver-
group_by: Defines how alerts are grouped together. In this case, alerts with the same
alertnamewill be grouped. -
group_wait: The amount of time to wait before sending a notification for a new alert group. This helps in aggregating alerts and avoiding notification floods.
-
group_interval: The minimum time interval to wait before sending a notification for new alerts that belong to the same alert group.
-
repeat_interval: The interval at which notifications are resent if the alert is still active.
-
receiver: The name of the default receiver to which alerts are sent if no other route matches.
Receivers #
The
receiverssection defines where the alerts should be sent. Each receiver can have different configurations for different alerting mechanisms (e.g., email, Slack, webhook).receivers: - name: 'email-notifications' # Receiver name email_configs: - to: [email protected] # Email recipient from: [email protected] # Email sender smarthost: smtp.gmail.com:587 # SMTP server auth_username: your_email # SMTP auth username auth_identity: your_email # SMTP auth identity auth_password: "xxxx xxxx xxxx xxxx" # SMTP auth password send_resolved: true # Send notifications for resolved alerts-
name: The name of the receiver. In this example, it’s
web.hook. -
webhook_configs: Defines the webhook configurations for the receiver. Alerts will be sent to the specified URL.
-
Replace
auth_username&auth_identitywith your email address, and forauth_passwordgenerate an app password instead of email password. -
You can read here how to generate the app password for gmail:
Inhibit Rules #
The
inhibit_rulessection defines rules to mute certain alerts if others are firing. This is useful to avoid redundant alerts and reduce alert noise.inhibit_rules: - source_match: severity: 'critical' # Source alert severity target_match: severity: 'warning' # Target alert severity equal: ['alertname', 'dev', 'instance'] # Fields to match-
source_match: Specifies the conditions that an alert must match to be a source alert (the alert that can inhibit others). In this case, alerts with
severity: 'critical'. -
target_match: Specifies the conditions that an alert must match to be a target alert (the alert that can be inhibited). In this case, alerts with
severity: 'warning'. -
equal: Lists the labels that must be equal between the source and target alerts for the inhibition to occur. Here, the inhibition will happen if the
alertname,dev, andinstancelabels are equal.
-
-
Step 2: Verify Setup #
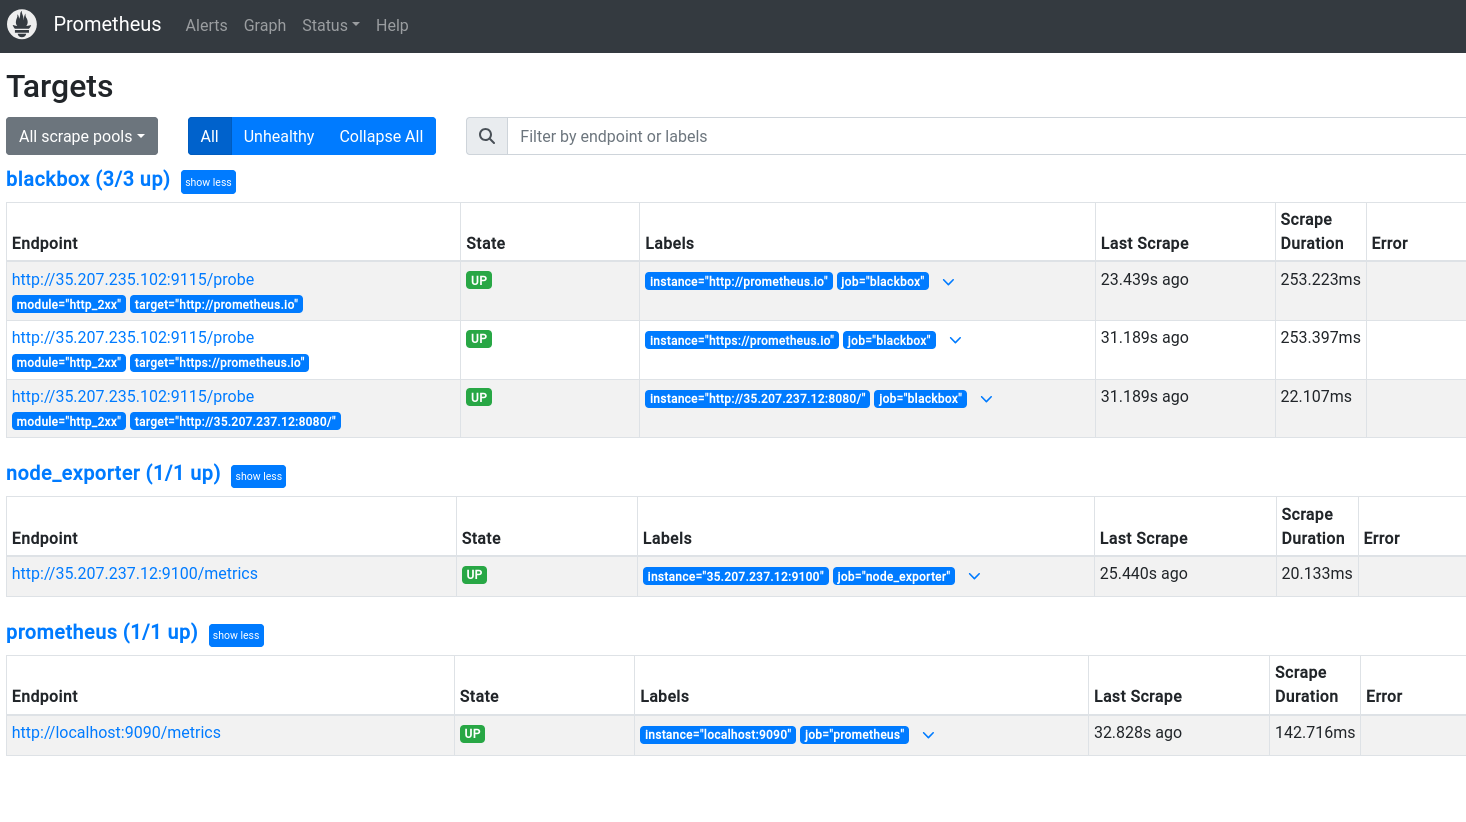
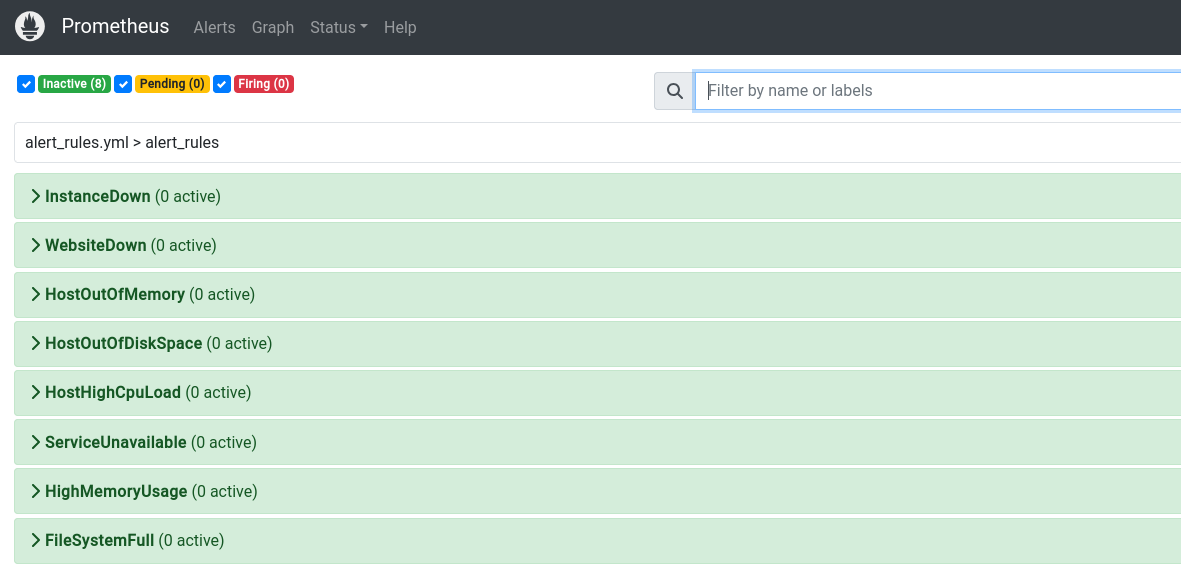
Access Prometheus at http://<monitoring_VM_IP>:9090 and ensure all targets are up. Check the metrics to ensure they are being collected correctly.

Step 3: Simulate Downtime and Verify Alerts #
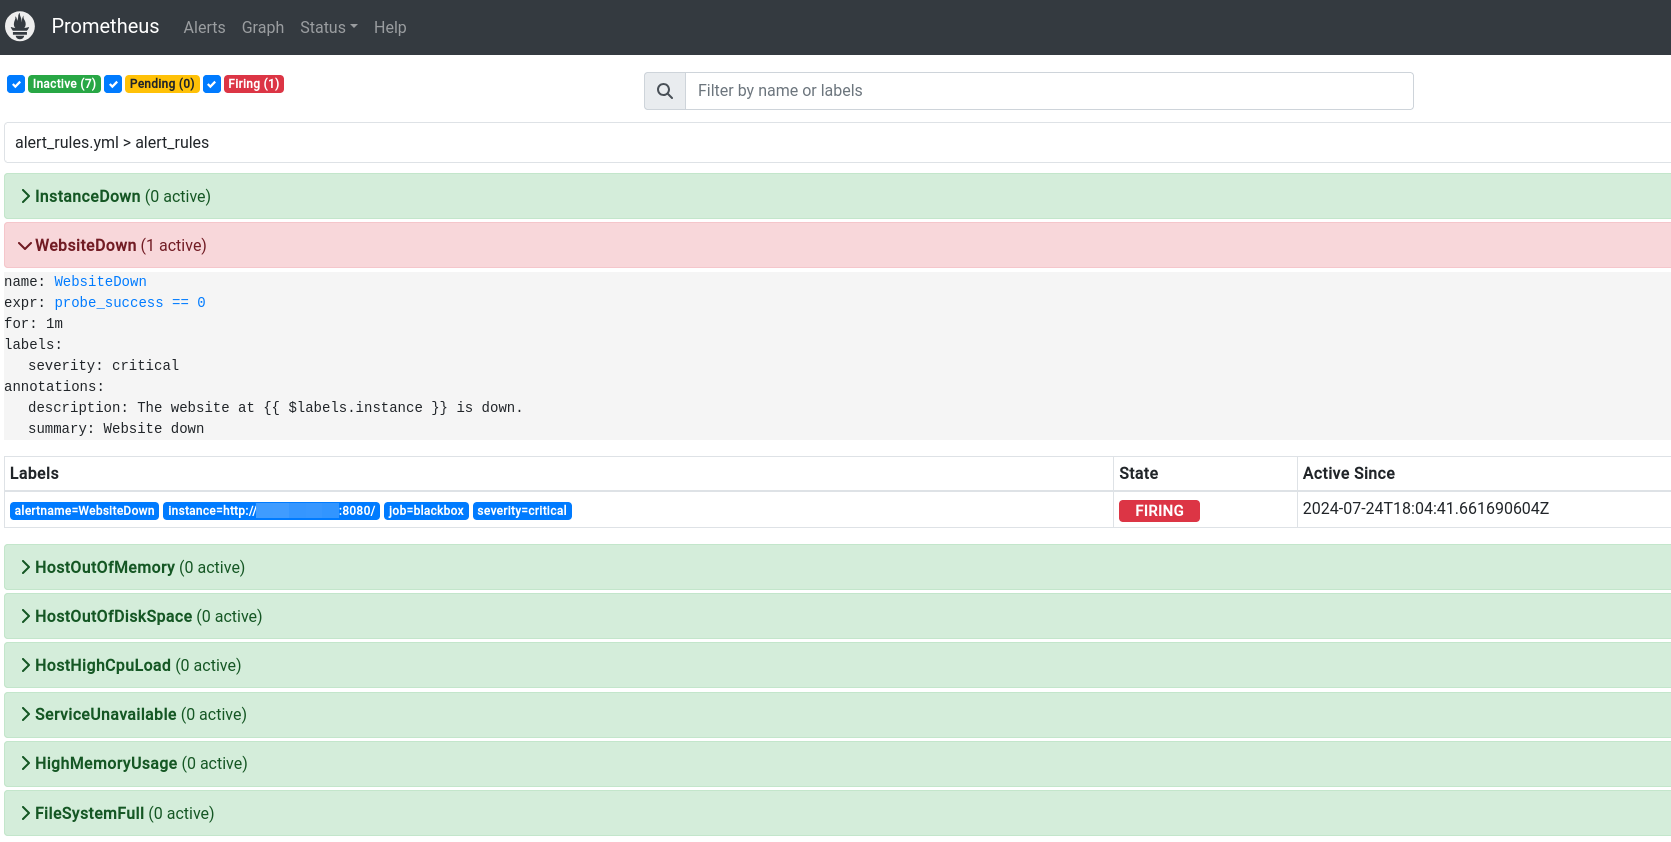
Stop the website or VM services to trigger alerts and verify that email notifications are received as expected.
-
Let’s stop our application and test the alert (in NodeExporter VM, kill java process and app will be down):
-
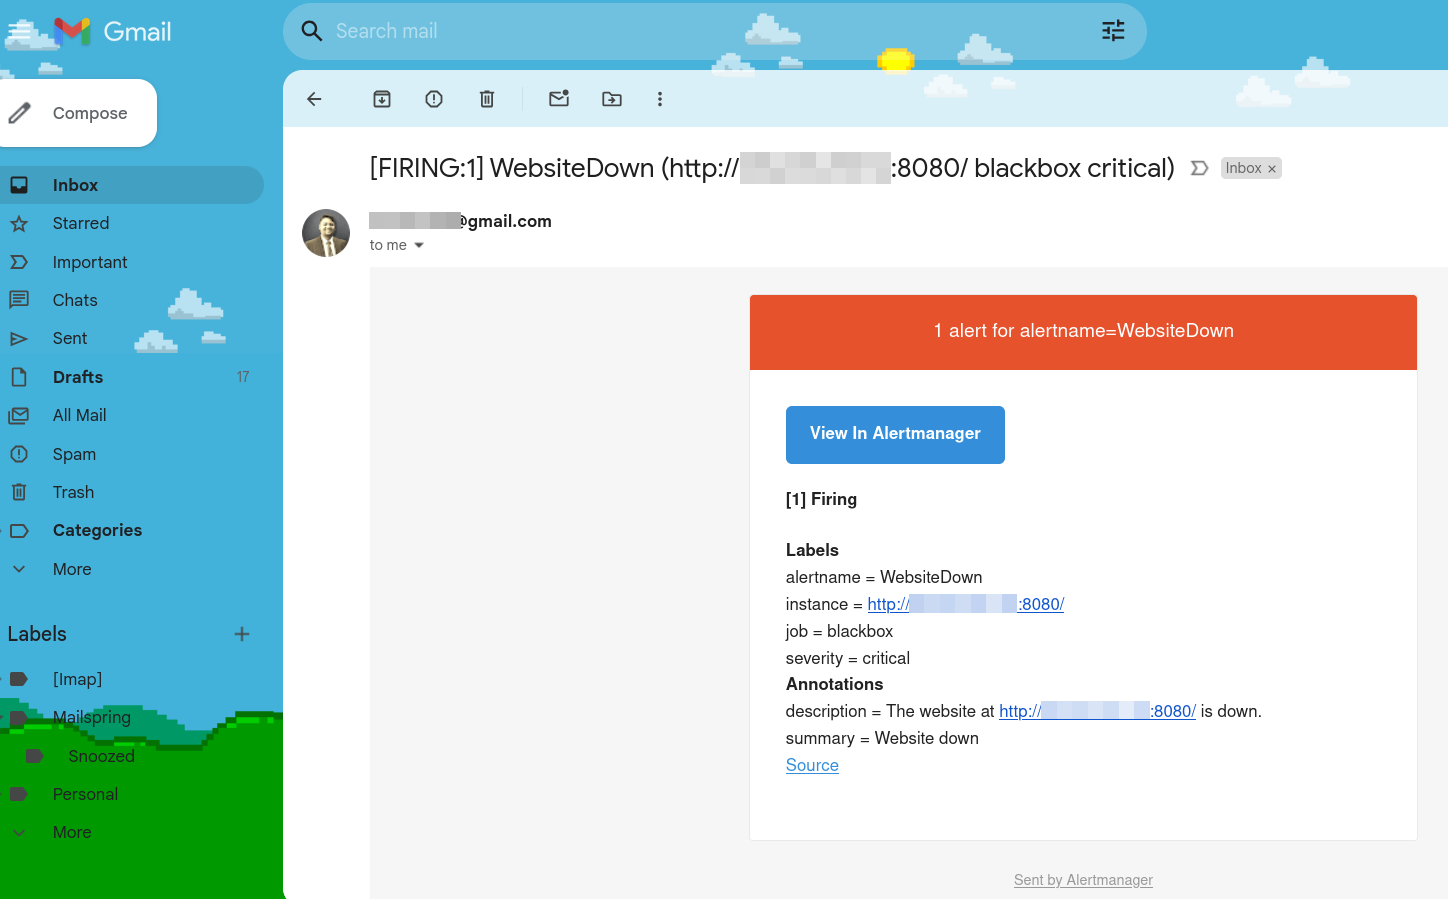
And within a minute we received Email notification that our website is down:
-
Conclusion #
By following these steps, you can set up a robust monitoring system using Prometheus, Node Exporter, Blackbox Exporter, and Alertmanager. This setup will ensure that you are promptly notified of any issues, allowing for quick resolution and maintaining system reliability. Implementing such a monitoring solution is a critical aspect of effective DevOps practices, ensuring that your services are always available and performing optimally.
Throughout this endeavor, I encountered and overcame several challenges, each of which provided valuable insights and reinforced best practices in DevOps Monitoring. The experience has been immensely rewarding, enhancing my skills and deepening my understanding of end-to-end deployment processes.
This project represents a significant milestone in my professional journey, showcasing my ability to design, implement, and manage complex deployment pipelines and infrastructure. As I look to the future, I am excited about the potential for further improvements and the opportunity to apply these learnings in new and innovative ways.
Thank you for taking the time to read about my DevOps project. I hope you found this exploration insightful and valuable. I am always eager to connect with fellow enthusiasts and professionals, so please feel free to reach out to me for further discussions or collaborations. Your feedback and suggestions are highly appreciated as they help me grow and refine my skills.
Let’s continue to deploy, monitor and innovate together!
Connect with me onLinkedInor check out the project’sGitHub repository. Feel free to leave your comments, questions, or suggestions below.